
A busy week of earnings, trade negotiations, and monetary policy meetings left the S&P 500 down around 0.5%. Buyer fatigue appeared to be setting in at this stage of the recovery as risk appetite from positive trade headlines faded by Friday. The broader market also faced major overhead resistance and profit-taking pressure from retail investors, who have been the backbone of the rally over the last month. Earnings continued to come in better-than feared, but “tariff uncertainty” continued to get flagged on most conference calls. The Federal Reserve (Fed) kept rates unchanged and stuck to its patient approach with monetary policy, despite notable downgrades to economic growth estimates and rising recession probabilities since their last meeting.
Bottom line, we remain neutral on equities tactically as the risk-reward trade-off does not appear very attractive right now, and we cannot dismiss the chances of a reversal lower in the coming weeks.
Buyer Fatigue Despite Positive Trade News
The White House announced its first official trade deal with the U.K. last week. The agreement provided U.K. steel and aluminum reciprocal tariff exemptions and lowered British car imports to 10% from 25% for the first 100,000 vehicles. In return, the U.K. agreed to purchase Boeing jets, waive U.S. beef imports (previously at 20%), and reduce levies on ethanol. The agreement fell short of a full-blown trade deal, but negotiations are ongoing, and most importantly, it marked an important step in the right direction for trade policy. On that note, Treasury Secretary Scott Bessent met with his Chinese counterpart over the weekend in Switzerland, marking the first public trade discussion between the two countries. Heading into the meeting, Bessent voiced optimism for a “de-escalation” in trade tensions with China, while President Trump posted on social media that an 80% tariff on China “seems right,” encouraging China to “open up its market to the U.S.” The weekend meeting seemed to go well as both sides agreed to a 90-day tariff reprieve, with the U.S. reducing its tariff to 30% from 145% and China cutting its levies to 10% from 125%.
The transition from tariff rates, retaliation, and ultimately to trade deals is an important sequence for the recovery in U.S. equity markets. And while we welcome the recent progress and administration’s ability to bring countries to the negotiating table, there are still a lot of wrinkles to iron out on the trade front before President Trump’s 90-day reciprocal tariff pause expires (we would not be surprised if the pause gets extended given the current deal count). We also learned last week that positive trade headlines alone may not be enough to keep buyers engaged in this recovery. The lack of investor response could partially be due to the likelihood of the 10% universal tariff rate being maintained.
Federal Reserve Remains Patient
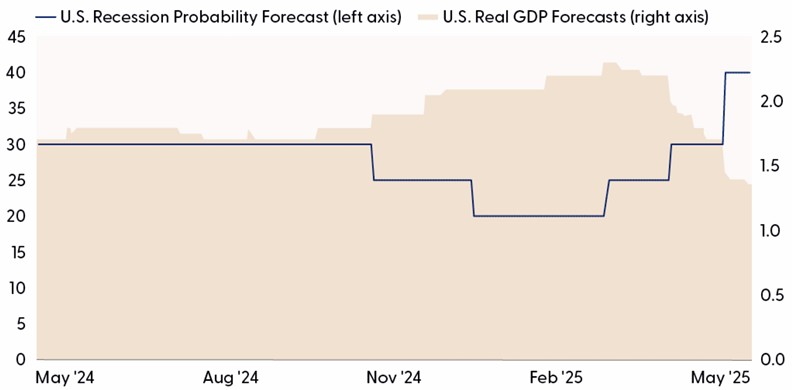
There were few surprises following last week’s Federal Open Market Committee (FOMC) meeting as policymakers left interest rates unchanged as expected. The accompanying policy statement flagged increased uncertainty over the economic outlook as risks of higher unemployment and higher inflation have risen. Based on this backdrop, Fed Chair Jerome Powell reiterated that when it comes to cutting rates, “We don’t think we need to be in a hurry.” The Fed has remained steadfast with its patient approach despite notable markdowns to growth expectations, rising recession forecasts, and elevated levels of economic uncertainty (something Powell mentioned nine times in his post-FOMC press conference). In our annual outlook published late last year, we expected the economy to grow 1.9% in 2025, but with the shock to international trade and subsequent effects on business investment, consumer spending, and broader inflation, we could see growth slow down to 1.3% with odds of recession approaching 50 – 50.
Recession Odds Rise as Growth Forecasts Cool
Source: LPL Research, Bloomberg 05/08/25
Disclosures: Past performance is no guarantee of future results.
All indexes are unmanaged and can’t be invested in directly.
A relatively strong but balanced labor market has helped support the higher-for-longer policy (also a primary reason why a recession is not in our base case forecast this year). On the other side of the mandate, price stability, the Fed Chair voiced confidence that longer-term inflation expectations will remain anchored near their 2% goal but acknowledged sustained and significant tariff rates could underpin upside risk to pricing pressure.
In summary, don’t hold your breath for a rate cut next month as the Fed is clearly in “wait and see” mode as trade negotiations play out. The fed funds futures market points to around a 70% chance of a 0.25% rate cut at the end of July.
Sustainable Recovery or Relief Rally?
Stocks have staged an impressive recovery since the April 8 closing low. The S&P 500 has rallied over 13% since then and is trading only a few points away from its April 2 reciprocal tariff announcement level. As we outlined back on April 14 (Decent Chance Stock Market Bottom Is in but Far From Certain), technical signs of a capitulation were evident in early April. Historically oversold momentum, indiscriminate selling pressure, washed-out market breadth, and contrarian levels of bearish sentiment expressed in the CBOE Volatility Index (VIX) and investor surveys all pointed to a low likely being reached last month. However, the sharp rate of change off the April 8 low has been surprising, especially when it was accompanied by a 9.5% single-day rally. This leaves many investors questioning the sustainability of the recovery.
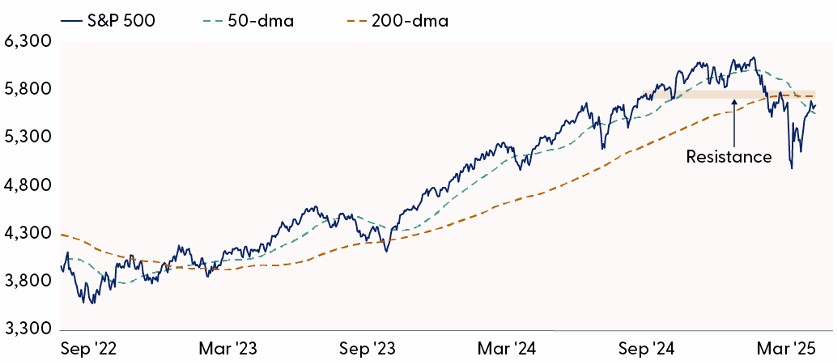
Technically, the S&P 500 has made a lot of progress after finding support near the 4,800–4,835 range. However, the bull’s biggest test lies near the approaching 200-day moving average (dma) at 5,748, an area that coincidentally overlaps near the late March highs. A breakout above this area of overhead resistance would not only raise the probability of a sustained recovery, but also potentially open the door for institutional demand entering the market via renewed interest from trend-following funds.
The Broader Market Is Approaching Key Overhead Resistance
Source: LPL Research, Bloomberg 05/08/25
Past performance is no guarantee of future results.
All indexes are unmanaged and can’t be invested in directly.
As mentioned previously, the speed of the recovery has been surprising, especially against a messy macro backdrop riddled with questions over global trade policy. History also reveals that most bottoms play out as a process that often involves a retest of the initial lows. V-shaped recoveries are rare and typically accompanied by a pivot from the Fed, an unlikely scenario given Chair Powell’s continued patient approach with monetary policy.
Over the last 75 years, we found that whenever the S&P 500 fell by 15% or more from a record high, the index recorded an additional average and median drawdown of around 18–19% over the following 12 months. The current 5.5% drawdown since April 4, when the S&P 500 officially breached the 15% decline threshold, would mark the smallest decline among the 14 other occurrences since 1950. Furthermore, of those 14 occurrences, eight overlapped with a recession.
While this data suggests there could be some downside risk ahead, there is some positive news. Forward 12-month S&P 500 returns have averaged around 8% after the index fell by 15% or more from a record high, with 64% of periods producing positive results, though past performance is no guarantee of future results.
S&P 500 Returns and Drawdowns After a 15% Declin

Source: LPL Research, Bloomberg 05/08/25
*Return from 4/4/2025 to 5/8/2025. Each period represents a unique 15% or greater drawdown from a record high. Past performance is no guarantee of future results. All indexes are unmanaged and can’t be invested in directly. The modern design of the S&P 500 stock index was first launched in 1957. Performance back to 1950 incorporates the performance of the predecessor index, the S&P 90.
Sell in May and Go Away?
Weak seasonality could potentially complicate the broader market’s recovery as May kicks off the worst six-month stretch for the S&P 500, giving some credence to the popular “Sell in May and Go Away” seasonal strategy. This popular Wall Street saying has its roots in London, where it was originally phrased as “Sell in May and go away, come back on St. Leger’s Day.” (The St. Leger is a renowned horse race in the U.K., dating back to 1776.) The concept behind this adage is that investors should sell their stocks in May, take a break during the summer to avoid seasonal market downturns, and return to the market in November, when conditions are typically more favorable.
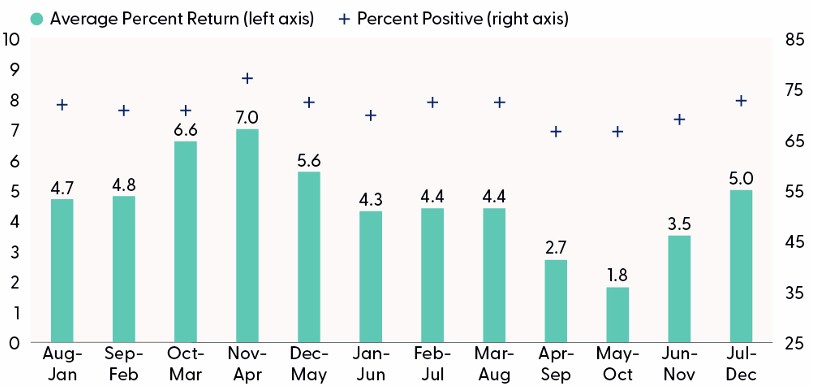
The “Stocks Are Entering a Weak Seasonal Period” chart highlights rolling six-month price returns for the S&P 500 across all 12-month periods since 1950. And while the May through October time frame has historically generated an underwhelming average gain of only 1.8%, returns have been positive 65% of the time. On a more positive note, the more recent “Sell in May” time frame has yielded better results. Over the last 11 years, the respective median and average index returns from May through October were 3.1% and 4.9%, with 82% of periods producing positive results.
Important to note, seasonality data can provide important insights into the potential market climate, but it doesn’t represent the current weather. Tariff uncertainty, monetary policy, and a potential transition toward more pro growth policies, such as tax cut extensions and deregulation, are much more important forces driving price action.
Stocks Are Entering a Weak Seasonal Period
Source: LPL Research, Bloomberg 05/08/25
Past performance is no guarantee of future results. All indexes are unmanaged and can’t be invested in directly. The modern design of the S&P 500 stock index was first launched in 1957. Performance back to 1950 incorporates the performance of the predecessor index, the S&P 90.
Summary
Trade negotiations are progressing as the White House hints at several deals in the near-term pipeline. The temporary tariff deal reached over the weekend with China provides another win for the administration and allows them more time to negotiate a more comprehensive agreement. However, headline risk and uncertainty over where tariff rates ultimately land remain elevated. Furthermore, we learned last week that positive trade news alone may not be enough to push the broader market above key resistance. A boost from an accommodative Fed policy pivot appears unlikely as policymakers deal with rising risks of higher unemployment and higher inflation. History also reveals that major market bottoms tend to play out as a process and that V-shaped recoveries are rare, while a weak seasonal setup could further weigh on sustainable risk appetite.
Asset Allocation Insights
LPL’s Strategic and Tactical Asset Allocation Committee (STAAC) maintains its tactical neutral stance on equities. During periods of policy uncertainty, LPL Research prefers to stray little from its benchmarks. In that spirit, the Committee recently upgraded emerging market (EM) equities to neutral, leaving regional preferences across the U.S, developed international, and EM aligned with benchmarks.
Following the recent stock market rebound, the Committee does not rule out the possibility of a reversal lower and/or a retest of the prior lows due to the ongoing uncertainty around tariffs and the increased risk of recession. At the same time, our recently updated S&P 500 price target range points to a relatively balanced risk-reward trade off based on current market levels. LPL Research continues to monitor tariff negotiations, economic data, earnings, the bond market, and various technical indicators to identify a potentially more attractive entry point to add equities.
Within fixed income, the STAAC holds a neutral weight in core bonds, with a slight preference for mortgage-backed securities (MBS) over investment-grade corporates. In our view, the risk-reward for core bond sectors (U.S. Treasury, agency MBS, investment-grade corporates) is more attractive than plus sectors. We believe adding duration isn’t attractive at current levels, and the STAAC remains neutral relative to our benchmarks.
Important Disclosures
This material is for general information only and is not intended to provide specific advice or recommendations for any individual. There is no assurance that the views or strategies discussed are suitable for all investors or will yield positive outcomes. Investing involves risks including possible loss of principal. Any economic forecasts set forth may not develop as predicted and are subject to change.
References to markets, asset classes, and sectors are generally regarding the corresponding market index. Indexes are unmanaged statistical composites and cannot be invested into directly. Index performance is not indicative of the performance of any investment and do not reflect fees, expenses, or sales charges. All performance referenced is historical and is no guarantee of future results.
Any company names noted herein are for educational purposes only and not an indication of trading intent or a solicitation of their products or services. LPL Financial doesn’t provide research on individual equities.
All information is believed to be from reliable sources; however, LPL Financial makes no representation as to its completeness or accuracy.
All investing involves risk, including possible loss of principal.
US Treasuries may be considered “safe haven” investments but do carry some degree of risk including interest rate, credit, and market risk. Bonds are subject to market and interest rate risk if sold prior to maturity. Bond values will decline as interest rates rise and bonds are subject to availability and change in price.
The Standard & Poor’s 500 Index (S&P500) is a capitalization-weighted index of 500 stocks designed to measure performance of the broad domestic economy through changes in the aggregate market value of 500 stocks representing all major industries.
The PE ratio (price-to-earnings ratio) is a measure of the price paid for a share relative to the annual net income or profit earned by the firm per share. It is a financial ratio used for valuation: a higher PE ratio means that investors are paying more for each unit of net income, so the stock is more expensive compared to one with lower PE ratio.
Earnings per share (EPS) is the portion of a company’s profit allocated to each outstanding share of common stock. EPS serves as an indicator of a company’s profitability. Earnings per share is generally considered to be the single most important variable in determining a share’s price. It is also a major component used to calculate the price-to-earnings valuation ratio.
All index data from FactSet or Bloomberg.
This research material has been prepared by LPL Financial LLC.
Not Insured by FDIC/NCUA or Any Other Government Agency | Not Bank/Credit Union Guaranteed | Not Bank/Credit Union Deposits or Obligations | May Lose Value
For public use.
Member FINRA/SIPC.
RES-0004065-0425 Tracking #738312 | #738315 (Exp. 05/26)