As Election Day approaches, we discuss potential stock market implications of various possible outcomes. But before we get into that, we offer our regular public service announcement around elections and investing. Political views are best expressed at the polls and not in portfolios.
Stocks have fared well under Democrats and Republicans, in unified and divided government, and in polarizing political environments. Capitalism and corporate profits drive markets more than politics. Narrow majorities in Congress take out extremes, helping to mitigate the risk that bad economic policy substantially weakens the U.S. economy. Geopolitical threats are serious, no doubt, and can disrupt the U.S. economy temporarily, but our economy and financial markets are incredibly resilient.
Policy Differences
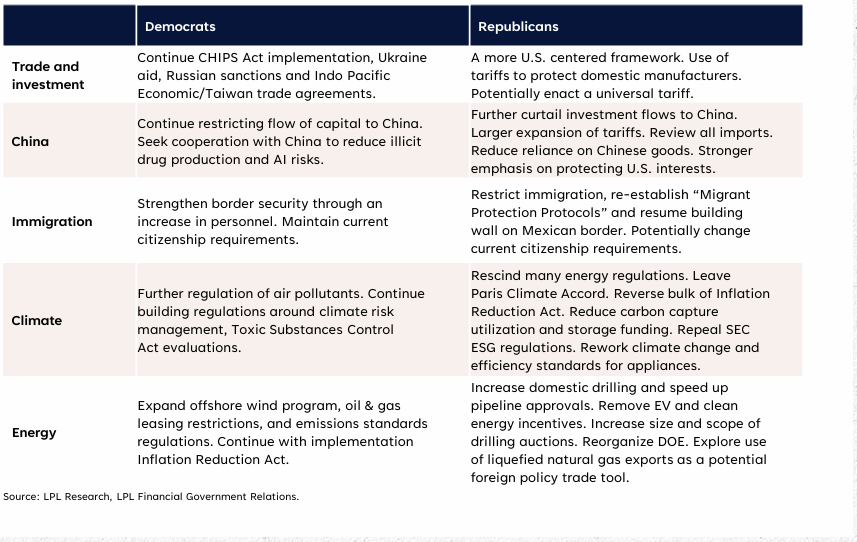
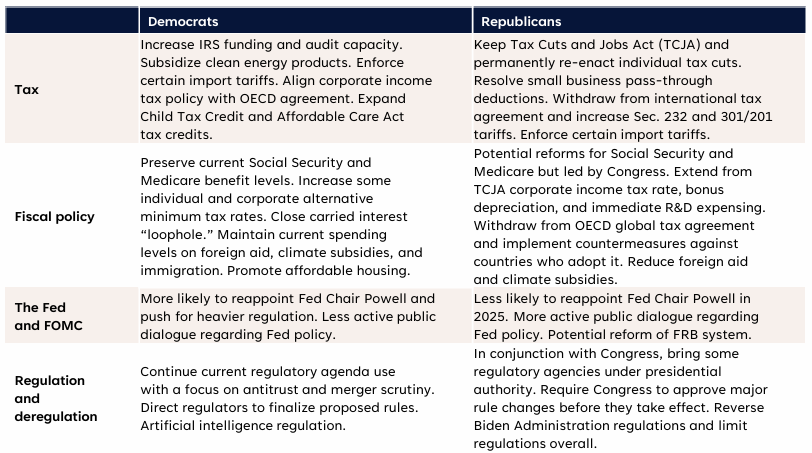
Before getting into potential stock market implications of this week’s presidential election, we want to again lay out some of the policy differences between candidates — some more market-moving than others. The table below, which is taken from This Time Will Be Different, a recent whitepaper LPL Research published along with our friends from the LPL Financial Government Relations team, provides helpful context for the investment discussion that follows.
2024 Election: Summary of Key Policy Items
Source: LPL Research, LPL Financial Government Relations.
2024 Election: Summary of Key Policy Items (continued)
Source: LPL Research, LPL Financial Government Relations.
In terms of market-moving policy differences between candidates, we would highlight these three areas:
#1: Trade/Tariffs
Former President Trump would likely be more aggressive with tariffs than Vice President Harris. Higher tariffs directly impact costs, and therefore the bottom line, for the many U.S. companies that import materials and finished products from China, Mexico, and elsewhere. Our best guess is that potential new or higher tariffs would be targeted rather than universal, but we take Trump’s threats to raise tariffs on Chinese imports seriously. Those “taxes” on imports could hit consumer goods, which the Trump Administration essentially left untouched in 2017–2020, but industrial materials and products are likely to absorb the bulk of additional tariffs.
Importantly, a president can take tariff actions without congressional approval, making them a very likely lever for the White House to pull. While the occupant of the White House will determine how much that lever is pulled, President Biden extended Trump’s tariffs, and even a Harris Administration could use them selectively for leverage if U.S.-China tensions escalate, with a particular focus on national security.
Bottom line, more tariffs could hurt profit margins for importing companies (which is most of them) and be a drag on sales for companies operating in markets outside the U.S., particularly in China, in the event of retaliation. This risk is broad, as both industrial and consumer goods companies could be affected. Pay close attention to how markets in China and Mexico react (so watch emerging markets carefully), as they are likely to be initial targets. A Trump win would likely escalate trade tensions in Europe as well, which could have an even broader impact. A Trump victory would likely be bullish for the dollar and yields, while a Harris win could result in a weaker dollar and lower yields.
Gauging the impact of tariffs and trade policy on corporate profits is difficult, and de-globalization of the U.S. economy will continue under any election outcome. But at a high level, this risk supports LPL Research’s preference for U.S.-focused equity and fixed income portfolios and justifies a more modest outlook for equities and greater volatility in the near term.
#2: Expiration of the Tax Cuts and Jobs Act of 2017
While trade policy is perhaps the most impactful policy factor for markets in the near term, the implications of this election on tax negotiations when the Tax Cuts and Jobs Act of 2017 expires at the end of 2025 are perhaps the most interesting.
First, it’s worth pointing out that whatever the election outcome, any majorities in Congress will be narrow. It’s not as simple as Trump extending all the tax cuts if he wins and Harris extending cuts for those with incomes below $400,000 and adding child tax credits if she wins. Divided government and small majorities would act as restraints on how much in tax cuts can be extended. There will be horse trading (though less in a Republican sweep). And as we wrote about in last week’s Weekly Market Commentary, “What Scares Us About the Economy and Markets”, the federal deficit will become a bigger problem for the next administration, so there is a limit to how many more trillions can be added to the U.S. debt pile.
The most impactful element of this negotiation for stocks will likely be the corporate tax rate. In a Republican sweep, we would expect the current 21% rate to hold, with additional tax cuts for domestic production to perhaps lower the effective rate slightly from there. We don’t think we can afford the 15% that Trump has proposed on the campaign trail.
In a Harris victory with a divided government (we do not expect the Democrats to hold the Senate), we would expect the corporate rate to be raised, potentially to 25%. Corporate profits will take a small hit, probably no more than a few percentage points. So, we could potentially get a $10–$15 per share reduction in S&P 500 earnings in 2026 (LPL Research forecasts $260 in S&P 500 earnings per share in 2025 and will roll out an estimate for 2026 next month). International tax policy can also move the needle, so that’s something to watch as well.
What does this mean for investors? Well first, lower tax rates could help boost small caps and domestic oriented industries like healthcare services, real estate, and utilities. Higher tax rates (and lower tariffs) could help multi-national, low-tax corporations that make up the industrials and technology sectors. And on the individual side, higher tax rates on consumers at high-income levels would not likely have much impact on consumer spending, but more subsidies for lower-income folks under Democratic leadership could help consumer staples.
#3: Deregulation
Regulation is likely to be tougher under President Harris than President Trump 2.0, which is why the so called “Trump trade” often includes banks at the top of traders’ buy lists. We would agree that deregulation is perhaps most meaningful for banks, but the Federal Reserve (Fed) already watered down bank capital rules so the benefits may be more muted. Energy is another heavily regulated sector whose fortunes would be very different under Harris vs. Trump (especially if you believe Harris may be more of a clean energy/electric vehicles/climate advocate than Biden).
While Trump would likely be better for banks, translating policy to stock performance for the energy sector is difficult. We may get more oil and gas production under Trump, but that could result in lower prices and limit gains for energy stocks. And if production and liquid natural gas exports are limited by a Harris administration, then that may lead to higher prices and help energy stock performance. Also consider production is at record levels now under Biden-Harris. Bottom line, LPL Research recommends investors underweight the energy sector on the expectation that oil and gas prices remain range bound. We would temper expectations for energy outperformance in the event of a Trump win, and we would not have confidence in incremental weakness due to a Harris presidency.
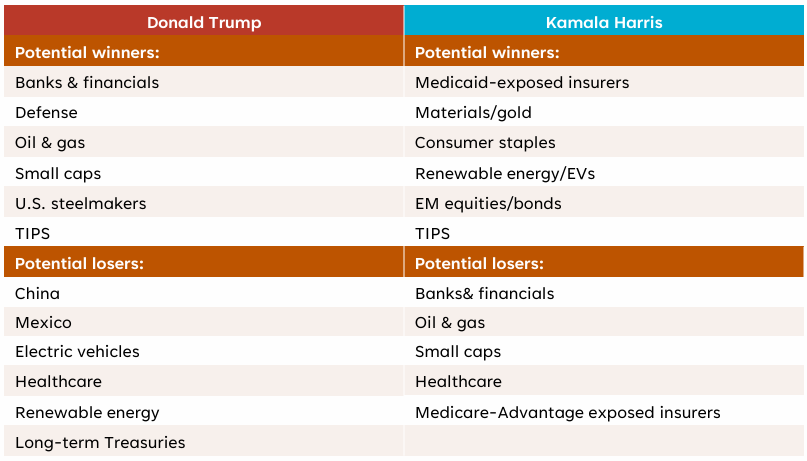
These and other potential election winners and losers are listed below
Winner of U.S. Presidential Election
Source: LPL Research, Evercore ISI, 07/30/2024
Disclosure: Forecasts may not materialize as predicted and are subject to change.
How Might the Broad Market React to Election?
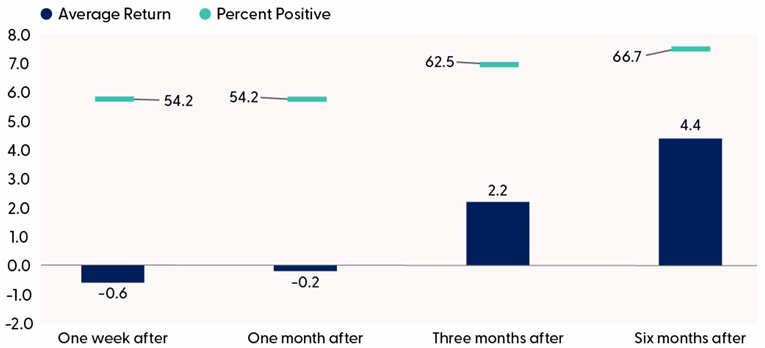
The history of stock market performance around elections suggests investors shouldn’t expect much from stocks over the next month. The “S&P 500 Performance After Election Day” table highlights how the S&P 500 performed after elections historically across various time frames (one week after, one month after, three months after, and six months after).
On average, the index has traded down marginally in the month after the election and only finished higher about half the time. Given the lack of volatility around policy implications from the election this time, and the strong year-to-date gains, we would put the odds of some weakness over the next few weeks as higher. Three and six months out, the story is a bit better, with gains coming about two-thirds of the time with average gains of about 2% per quarter.
Looking out longer term, the index has generated an average gain of 6.5% one year after elections, though with gains only slightly more likely than losses. Given high stock valuations, the potential for the economy to slow (but land softly), and the possibility of tax increases in 2026, we think double-digit returns in 2025 might be difficult to achieve.
Stocks Tend to Struggle Some Shortly After Election Day Before Moving Modestly Higher Several Months Later
S&P 500 Performance After Election Day (1928–2020)
Source: LPL Research, Bloomberg 10/31/24
Disclosures: Indexes are unmanaged and cannot be invested in directly. Past performance is no guarantee of future results. The modern design of the S&P 500 stock index was first launched in 1957. Performance back to 1950 incorporates the performance of the predecessor index, the S&P 90.
Sell in May Is Behind Us
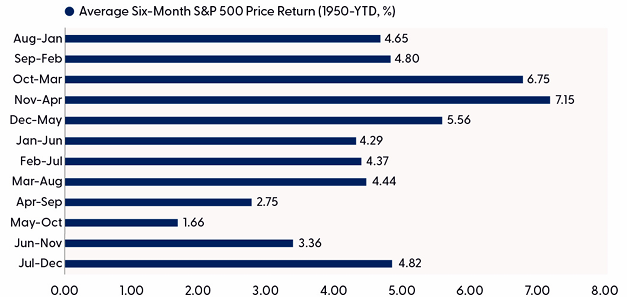
If volatility does pick up and stocks decline, seasonal trends (and of course, the fact we are in a strong bull market) suggest investors may want to consider buying the dip. The S&P 500 has wrapped up the widely discussed “Sell in May” period with an impressive 13.3% gain. For context, this six-month stretch spanning from May through October has been the weakest for the index, generating an average gain of only 1.7% since 1950.
History implies upside momentum could continue as stocks entered their best six-month stretch on Friday, November 1. From November through April, the S&P 500 has historically generated an average gain of 7.2%. Even during post-election years, returns have been above average at 5.3%. Furthermore, the S&P 500 has finished higher during this time frame 77% of the time, marking the highest positivity rate across all other six-month periods. These seasonal patterns don’t always hold, but in a bull market underpinned by a steadily growing economy, falling inflation, a Fed easing cycle, and solid earnings growth, the odds that stocks are higher over the next six months are probably higher than that 77%.
Seasonal Tailwinds Have Arrived
Source: LPL Research, Bloomberg 10/31/24
Disclosures: Indexes are unmanaged and cannot be invested in directly. Past performance is no guarantee of future results. The modern design of the S&P 500 stock index was first launched in 1957. Performance back to 1950 incorporates the performance of the predecessor index, the S&P 90.
Conclusion
Election Day is here. Expect more volatility, particularly if the wait for a result is a long one or if the transition of power is not peaceful. Political divisiveness presents a risk to investor sentiment, though having gone through the “hanging chads” of the Bush vs. Gore election in 2000, legal challenges, recounts, and the January 6 experience, perhaps markets are battle-tested for election chaos. We can also take some comfort in history’s lesson that stocks tend to move higher in the months after elections regardless of the outcome. Most stock price movements over time are driven by earnings, inflation, and interest rates. Policy does matter, particularly tax and trade policy, but not as much as some might think.
In terms of how investors should position portfolios, we would sit tight, wait for results, and then after the fact consider some shifts within politically sensitive segments of the market such as banks, energy, small caps, emerging markets, and bonds. Longer term, we expect the bull market to continue through 2025, but deficits and potential tax increases may contribute to more market volatility as the year progresses.
Asset Allocation Insights
Election uncertainty raises the possibility of a market sell-off in the short term, especially after the best start to an election year for stocks since the 1930s (thanks to Bespoke Investment Group for that interesting nugget). Despite policy uncertainty and rich stock valuations, this bull market continues to enjoy solid momentum. Economic growth, moderating inflation, and growing corporate profits continue to provide support. So, while political developments could drive short-term weakness, consider the best seasonal period of the year is here. And, as in all elections throughout our country’s history, a transition of power will occur and democracy, which can appear fragile at times, will survive regardless of how the votes come in.
LPL’s Strategic and Tactical Asset Allocation Committee (STAAC) continues to recommend investors stay fully invested at their targets for both equities and fixed income from a tactical asset allocation perspective — with potentially a small alternative investments position, funded from cash, to help mitigate potential volatility for appropriate investors. The Committee maintains a slight preference for growth over value, recommends keeping allocations across market caps generally in line with benchmarks, favors U.S. equities over their international and emerging markets counterparts and recommends an up-in-quality approach to fixed income.
Important Disclosures
This material is for general information only and is not intended to provide specific advice or recommendations for any individual. There is no assurance that the views or strategies discussed are suitable for all investors or will yield positive outcomes. Investing involves risks including possible loss of principal. Any economic forecasts set forth may not develop as predicted and are subject to change.
References to markets, asset classes, and sectors are generally regarding the corresponding market index. Indexes are unmanaged statistical composites and cannot be invested into directly. Index performance is not indicative of the performance of any investment and do not reflect fees, expenses, or sales charges. All performance referenced is historical and is no guarantee of future results.
Any company names noted herein are for educational purposes only and not an indication of trading intent or a solicitation of their products or services. LPL Financial doesn’t provide research on individual equities.
All information is believed to be from reliable sources; however, LPL Financial makes no representation as to its completeness or accuracy.
All investing involves risk, including possible loss of principal.
US Treasuries may be considered “safe haven” investments but do carry some degree of risk including interest rate, credit, and market risk. Bonds are subject to market and interest rate risk if sold prior to maturity. Bond values will decline as interest rates rise and bonds are subject to availability and change in price.
The Standard & Poor’s 500 Index (S&P500) is a capitalization-weighted index of 500 stocks designed to measure performance of the broad domestic economy through changes in the aggregate market value of 500 stocks representing all major industries.
The PE ratio (price-to-earnings ratio) is a measure of the price paid for a share relative to the annual net income or profit earned by the firm per share. It is a financial ratio used for valuation: a higher PE ratio means that investors are paying more for each unit of net income, so the stock is more expensive compared to one with lower PE ratio.
Earnings per share (EPS) is the portion of a company’s profit allocated to each outstanding share of common stock. EPS serves as an indicator of a company’s profitability. Earnings per share is generally considered to be the single most important variable in determining a share’s price. It is also a major component used to calculate the price-to-earnings valuation ratio.
All index data from Bloomberg.
This research material has been prepared by LPL Financial LLC.
Securities and advisory services offered through LPL Financial (LPL), a registered investment advisor and broker-dealer (member FINRA/SIPC). Insurance products are offered through LPL or its licensed affiliates. To the extent you are receiving investment advice from a separately registered independent investment advisor that is not an LPL affiliate, please note LPL makes no representation with respect to such entity.
Not Insured by FDIC/NCUA or Any Other Government Agency | Not Bank/Credit Union Guaranteed | Not Bank/Credit Union Deposits or Obligations | May Lose Value
For public use.
Member FINRA/SIPC.
RES-0002171-1024W Tracking # 652985 (Exp. 11/25)
